Ask ChatGPT

 Best AI papers explained
6 Oct 2026 · 23m · 10 chapters
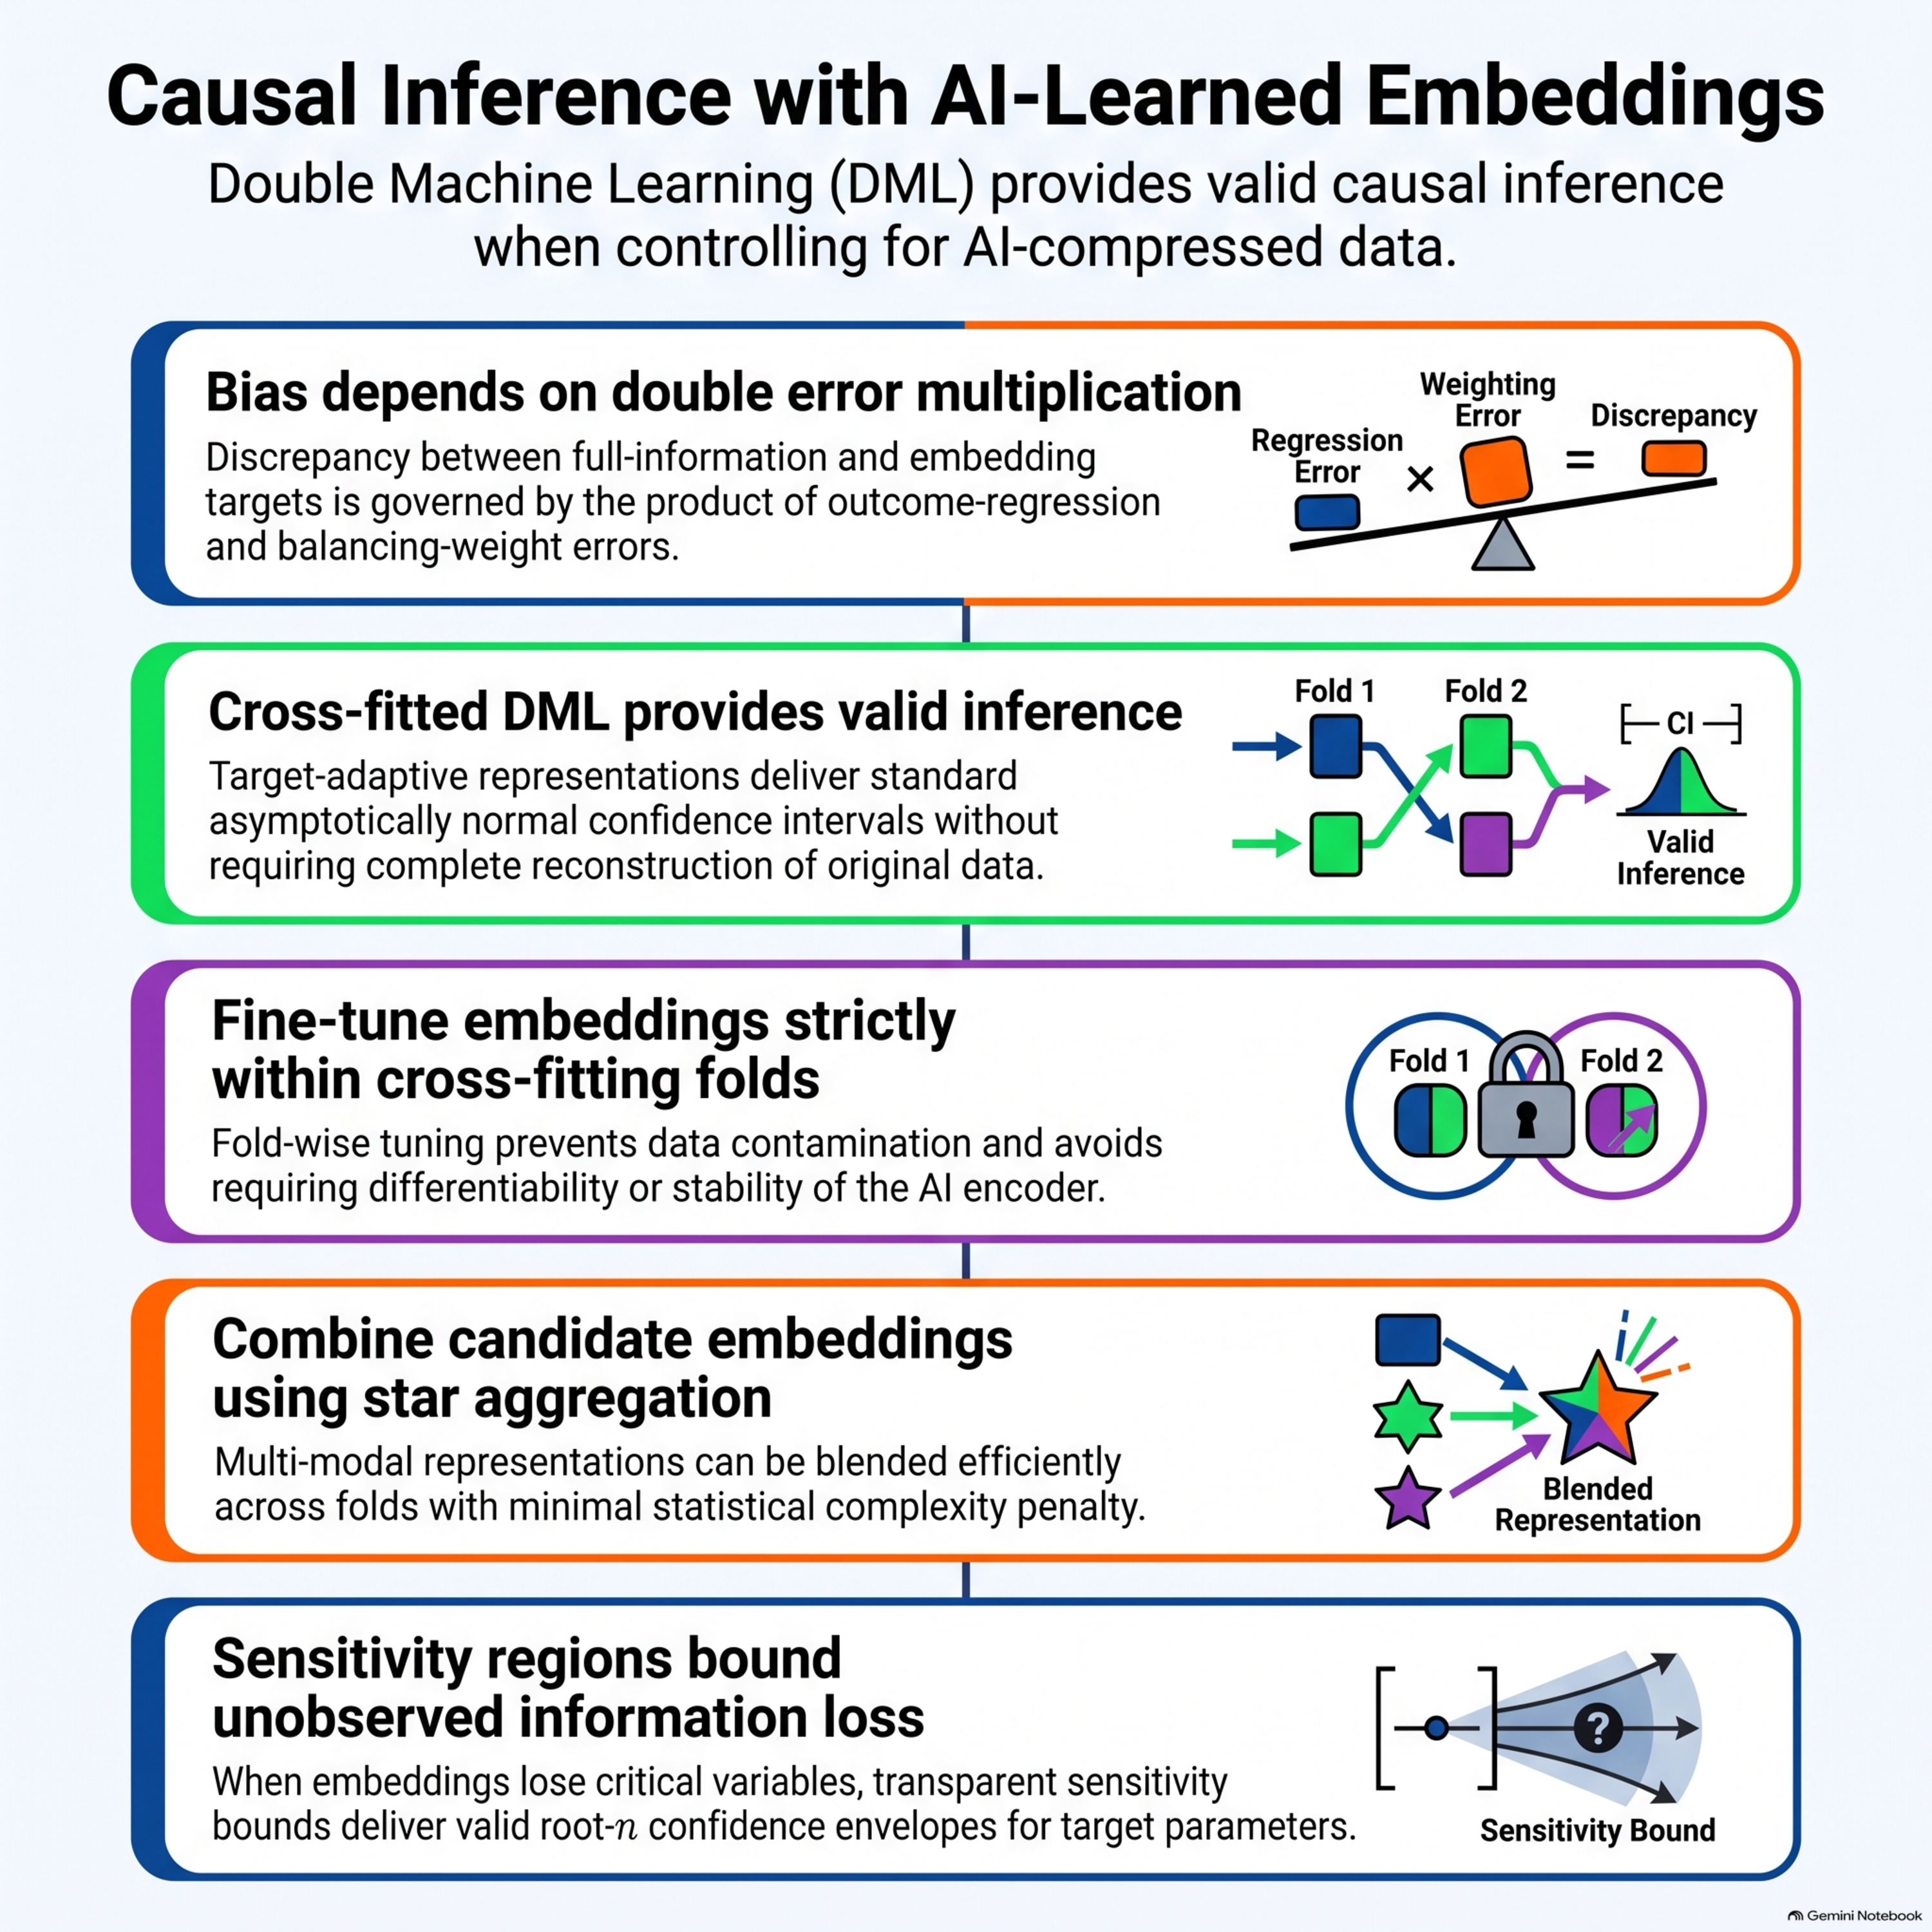
How to do causal inference when analysts replace raw, messy data with AI-learned embeddings, risking “target gap” between true causal effects and AI-based estimates.
The target gap equals the product of two representation errors: outcome regression error (predicting the outcome) and balancing weight error (predicting treatment assignment/context). If representations are “target adaptive” and “adaptively efficient,” causal estimates using compressed data converge to full-information causal results. Practical methods: fold-wise tuning (tune representations only on training folds), star aggregation (discrete mixing of multimodal models via a “star” center and 1D fader search), and sensitivity inference (calibrate worst-case bounds under missing information).
Keepa.com data on Amazon clothing/shoes price elasticity using inverse rank proxies; elasticity becomes more precise when combining text, images, and tabular data; star aggregation chooses different model centers for outcome vs balancing weight; worst-case elasticity upper bound remains negative (about -0.723).
No guests mentioned; only host/host-like dialogue.
Written by AI. May contain mistakes.
Exploration of how traditional statistics conflict with AI methods.
“Because we need to know we aren't losing the actual mathematical truth of what causes what.”
Discussion on the necessity of understanding causal relationships in data.
“Did this specific drug cure the illness?”
Differentiating between ATE and APE and their implications.
“If we don't need all the information, the obvious next question for you listening is, well, what exact information do we actually need to keep?”
Understanding the discrepancy introduced by AI representations.
“So the AI needs to understand the context of the assignment.”
Introduction to mathematical breakthroughs in causal inference.
“It converges to the same result you'd get if you had all the data.”
Examining the two critical errors affecting causal analysis.
“and then evaluate it on your held-out data folds, the math still holds up perfectly.”
Translating theoretical concepts into practical data science applications.
“Then it mathematically draws individual lines or segments, connecting that winning vocal track to every other competitor on the menu.”
Learn about a real-world test using AI models to measure demand elasticity.
“To prove that these aggregation tools and theories actually work outside of a chalkboard, a massive real-world test was run using data scraped from Keepa.com.”
Explore the challenges of data integrity in AI and how to address them.
“utilizing both of these distinct custom-blended choices, came out to negative 1.053.”
Consider the implications of training AI to preserve causal truths while discarding other data.
“AI embeddings don't have to ruin causal inference.”

Get the gist, explore an idea or ask about something said.
 Claude
On Best AI papers explained, what are the key points of this episode?
Searching your listeningAutomatic transcript. May contain errors.
0:00Okay, so imagine you're compressing an image of a dog over and over again. Like every time you save it, you lose just a little more detail. Right. Until eventually it's just this blur of gray pixels. Exactly. You can't even tell it's a dog anymore. Well, what if I told you that data scientists are doing exactly that to our real world human behavior? They absolutely are. They're squishing our complex choices down into this mathematical blur to feed AI. And that is the massive collision happening right now in the world of data analysis. On one side, you have traditional cause and effect science, you know, the rigid math that tells you if I pull lever A, outcome B happens.
0:39Which is how we've always done things. Right. But on the other side, you have cutting edge AI. So the mission for today's deep dive is to figure out how we can trust AI generated summaries of the world. Because we need to know we aren't losing the actual mathematical truth of what causes what. It is the absolute core challenge of modern analytics right now. I mean, classical statistics was built for a world of tidy spreadsheets. Oh, yeah. The dream of the perfect Excel file. Exactly. You had a column for age, a column for income, maybe a column for whether someone bought a product. But modern data sets, they do not look like that at all.
1:15No, they're completely chaotic. Very chaotic. If you are analyzing an e-commerce platform, your data is this messy soup of high-resolution product photos, rambling customer reviews, and sequential transaction logs. And you can't exactly run a standard regression on a JPEG image. You really can't. So analysts compress that chaos. They use foundation models to turn a rich, multilayered document or image into an embedding. Which is essentially just the long list of numbers representing the AI's vibe check of that data, right? A vibe check is a great way to put it. And then they try to use that embedding as a control variable in their causal analysis.
1:53But the fear has always been that in generating that vibe check, the AI threw away the exact pieces of information that explain the cause and effect. Which is a very valid fear. But we now have a mathematical framework that actually provides a safety net for this exact problem. Which is a huge relief, honestly, because it feels like we're flying blind most of the time. So let's break this down. We really need to define the gap between the messy reality and the AI's version of it. Let's do it. So in the classical statistics world, when you have all the information perfectly laid out, you can calculate the average treatment effect or the ATE.
2:28The holy grail of data science. It really is. It's the true unfiltered impact of a decision. Did this specific drug cure the illness? Did this exact marketing email drive the sale? But when you replace all that rich data with an AI's compressed representation, you aren't calculating the ATE anymore. you're calculating something called the average predictive effect, or the APE. That is the fundamental shift. The average predictive effect relies solely on what the AI managed to learn and retain. So whatever survived the vibe check. Exactly. The mathematical distance between those two things, the true full information effect you want, and the AI's predictive effect that you are actually getting, is what we call the target gap.
3:13So every single time you use an AI representation instead of the raw data you introduce this gap. You do. You are inherently changing the regression structure. But more importantly, you are fundamentally changing the population parameter you are measuring. Because you aren't measuring the real world anymore, you are measuring the AI's interpretation of the real world. Spot on. But wait, if I swap a rich, beautifully complex customer profile for a flat AI embedding, aren't I inevitably losing the plot? Well, it feels that way, sure. I mean, it sounds like trying to write a nuanced review of a three-hour movie by only reading the Wikipedia plot summary.
3:49I like that analogy. Like, you're going to know the main character's name and who died at the end, but you're missing the subtle glances, the tone, the pacing. You're missing the actual mechanics of why the movie makes people cry. Right. So if our data is missing all that texture, how can we possibly claim to know the true cause and effect? Your fear is completely natural, but it stems from a misunderstanding of what the AI actually needs to accomplish here. The goal is not global reconstruction of the data. Okay, so it doesn't need the whole movie. No, the AI does not need to perfectly reconstruct the entire movie from the Wikipedia summary.
4:23It just needs to be what we call information lossless for your specific target. Information lossless. Meaning what exactly? It means causal math doesn't care about the whole picture. The AI only needs to preserve the highly specific components that actually determine the causal target you are studying. Oh, I see. So, to use your movie analogy, if you are only trying to measure whether explosions cause audience heart rates to spike, the subtle romantic glances between the characters are statistically irrelevant. Right. The math doesn't care about the romance. Exactly. If the AI drops the romance but perfectly tracks the explosions, it is information lossless for your specific question.
5:05Okay, that makes total sense. If we don't need all the information, the obvious next question for you listening is, well, what exact information do we actually need to keep? And how do we know the AI kept the explosions and not just the romance? Yes. And this brings us to the real mathematical breakthrough we are talking about today. It's known as the omitted information identity or the mixed bias identity. And the elegance of this math is staggering. It proves that the error we were just talking about, that target gap, is exactly the product of two very specific representation errors. Wait, the product, not a sum?
5:41Not a sum. They are multiplied together. And that multiplication aspect is the absolute linchpin of why this entire framework succeeds. Okay, so the gap is driven by the interaction of two distinct approximation errors. What's the first one? The first error is in predicting the outcome. We call this the outcome regression. Outcome regression, got it. As asking, how much information did the AI lose that was absolutely necessary to predict what happens at the end of the timeline? Did the customer buy the shoes or not? That is the outcome. Okay, so that's the first half of the multiplication. What's the second error?
6:13The second error is entirely different. It is the error in what we call the balancing weight, or formally the Reese representer. I want to pause on the Reese representer because that sounds like terrifying textbook jargon. It does sound a bit intimidating. Let's translate that functionally. This is basically the error in predicting the treatment itself, right? That is a great way to put it. The Reeves' representer is just a mathematical way of asking, why did this specific customer see this specific price in the first place? Like, what were the underlying conditions that caused the treatment to happen?
6:47Exactly. If you're a retailer, you don't just randomly assign prices. You discount winter coats in July. You raise umbrella prices during a rainstorm. So the AI needs to understand the context of the assignment. Yes. So how much information did the AI lose that explains that initial setup? That is your second error. And here is where it gets so incredibly cool. Because those two errors, the outcome error and the treatment error, are multiplied together. Right. So if just one of those errors is tiny, the overall error shrinks drastically. It collapses. Think about it like a massive bank vault that requires two distinct keys to turn simultaneously to let bias into your analysis.
7:31Key one is the outcome prediction. Key two is the treatment prediction. I love the vault analogy. Right, because if the AI perfectly copies just one of those keys, the fact that it completely mangled the other key doesn't matter. The vault is staying shut. If one error is zero, the product of the multiplication is zero. Your vault analogy is great, but let's add one crucial nuance to really nail the mechanism. It's not just about one error being literally zero, which is almost impossible in the real world. Sure. Real data is too messy for a perfect zero. Exactly. It's about how fast the product of the two errors shrinks as you feed the AI more data.
8:07Okay, walk me through that. If your representation is target adaptive, meaning the multiplication of those two errors gets smaller, faster than your sample size grows, then the standard math perfectly covers the true causal parameter. Oh, wow. And we can take this a step further into a state called adaptive efficiency. When the representation is both target adaptive and adaptively efficient, the AI short score actually converges to the efficient full information score. Wait, the short score? Yep. You mean the analysis done purely on the compressed blurred data? Yes. It converges to the same result you'd get if you had all the data.
8:45Meaning you get the absolute optimal mathematical precision. You get the exact same statistical power as if you had all the raw, messy, complex data sitting right in front of you, but you only had to do the math on the AI's compressed summary. It is a remarkable optimization. It allows analysts to achieve optimal precision without needing to lug the raw data into the final calculation. That is wild. You preserve the causal truth by ensuring your AI holds on to either the outcome predictor or the treatment predictor really well. If it holds both reasonably well, you hit that adaptive efficiency and your target gap effectively vanishes.
9:25So the vault key math works beautifully on a whiteboard, but how do we actually build this? That is the practical challenge, yes. Like if I am an analyst sitting at my desk, I don't just pick one AI model, freeze it, and pray it has the right keys to the vault. Data science involves constantly tweaking and testing. Absolutely. So how do we transition from this abstract identity to practical pipeline building without breaking the rules of the math? The breakthrough for practical application here is something called fold-wise tuning. Fold-wise tuning. Right. In modern workflows, representations are almost never static.
10:02You do not just download a massive language model and use it out of the box. You fine-tune it. You try different prompts. You tweak parameters. Exactly. You adjust it based on the specific task. And the mathematical framework here allows for this tuning on the fly. Oh, it does. I would have thought that ruins the controls. Not if you do it right. As long as you tune the model exclusively on your training data folds and then evaluate it on your held-out data folds, the math still holds up perfectly. Meaning you just have to keep your testing environment mathematically isolated from your training environment.
10:36Yes. The standard machine learning math still applies and protects your causal truth. Which brings up a massive operational headache, though. When we're fine-tuning, we have so many options. Too many options sometimes. Right. Maybe I want to use a text model for the product descriptions. But wait, I also have product photos, so I need an image model, and I have raw spreadsheet data. I essentially have a whole menu of discrete, entirely different models. You do. How does the math know which one to pick, or how to combine them? Well, when you're faced with a diverse menu of models like that, you run into the limitation of traditional mathematical blending.
11:13Normally, if models are somewhat similar, you can use standard continuous blending to just average them together. Sure, just mash them together and take the average. But when you have text embeddings, image embeddings, and tabular data, they speak fundamentally different mathematical languages. You have a discrete menu. So, a new mechanism was introduced called star aggregation. I love this concept. Now let's make it concrete. I imagine this like ordering appetizers for the table. Oh, here we go. I don't want to bet my entire dinner on just the wings. I want a menu. I want the wings, the sliders, and the nachos.
11:49But how does star aggregation actually blend these fundamentally different models together without making a mess? Think of star aggregation like a mixing board in a music studio. You have all your different tracks, the drums, the vocals, the guitar. Okay, I'm with you. The algorithm first looks at all the options on your menu and finds the empirical winner on the training data. Let's say the vocal track is performing the best. It designates that winner as the center of the star. So it makes that the master volume. Exactly. Then it mathematically draws individual lines or segments, connecting that winning vocal track to every other competitor on the menu.
12:27Just connecting them one by one. Yes. It then slides the faders up on the guitar, and then on the drums, just slightly, doing a simple one-dimensional search along those individual lines. Oh, that is so smart. It is hunting for the exact frequency where mixing in a tiny bit of a competitor actually improves the overall performance. And it does this without getting mathematically lost in the chaos of trying to adjust all the faders at once. That is brilliant. It mathematically guarantees you are starting from the strongest foundation but it leaves the door open to borrow the best insights from the weaker models.
13:03And crucially, star aggregation allows you to pool out-of-fold predictions. Which is a huge time saver, right? Enormous. To understand why this matters, imagine trading a billion-parameter AI model. It takes an enormous amount of computing power. Like weeks of processing and thousands of dollars. Exactly. In older causal frameworks, to prove your model worked, you had to use nested samples. splitting. You had to chop your data into pieces, train the model on piece A, test it on piece B, then chop it again, train it again, over and over. That sounds computationally devastating. It is. But star aggregation allows you to fit your aggregation weights across all your data folds at once without that nested splitting.
13:46It saves an unbelievable amount of processing time. So you can actually scale this framework even if your menu has dozens of massive foundation models. Precisely. Okay, so we've spent a lot of time on the theory and the mixing boards. Now we need to see how this handles the absolute chaos of a real marketplace. The real-world test. Yes. To prove that these aggregation tools and theories actually work outside of a chalkboard, a massive real-world test was run using data scraped from Keepa.com. Tracking the chaotic world of clothing and shoes sold on Amazon. Right. And the goal here was classic economics, to measure the demand response to price changes.
14:23Like if a seller raises the price of a pair of boots, how much does consumer demand drop? But there is a catch. Amazon does not publicly release exact sales figures. They hide the raw data. Of course they do. So demand had to be reverse engineered by using an inverse rank proxy. They looked at how a product's sales rank shifted when the price changed, using that rank as a stand-in for sales volume to calculate an elasticity. And clothing is fascinating for this because it's highly visual. Like you care about what the shirt looks like, but it also relies heavily on text, like the brand name, the material specs, the sizing.
15:00It's a truly multimodal problem. Exactly. So they didn't just run one model. They built seven different pipelines. They had AI models looking only at the text descriptions. They had models looking only at the product photos. And standard tabular models looking at the raw spreadsheet numbers. Right. And they tested various combinations of all three to see who held the keys to the vault. So what happened? When they ran the initial numbers, the results showed a highly stable negative response across the board, which makes economic sense. Raising prices lowers demand. But the precision varied wildly based on the data used, right?
15:34Let's look at the delta here because the meaning is everything. Let's do it. When they relied purely on the spreadsheet data, the tabular model, the elasticity was roughly negative 1.03. But when they started adding the AI embeddings, things shifted. They did. Using text and images brought it to negative almost 1.1. When they combined absolutely everything, the text, the images, and the raw spreadsheet data, the model locked in on a much more precise truth of negative 1.069. It proved that adding the visual and textual data changed our understanding of the cause and effect. But the most revealing part of the entire experiment was watching how star aggregation navigated those two separate keys we talked about earlier.
16:15No, that's the best part. Remember, the vault requires predicting the outcome and predicting the balancing weight. So for the outcome, star aggregation looked at the menu of models and flawlessly picked the image plus tabular model as the absolute best. Visual data combined with basic specs was all it needed to understand if someone would buy the shirt. But for the balancing weight, the AI trying to figure out why the seller priced the shirt that way in the first place, star aggregation did something entirely different. It completely swapped its strategy. It did. For the balancing weight, star aggregation set the text plus tabular model as the center of the mixing board, assigning it about 84 % of the weight.
16:56But then it slid the fader up, mixing in the full multimodal model for the remaining 16%. It custom built a hybrid. Because the image data was vital for understanding consumer demand. But the text data, the brand reputation, the specific product descriptions, was vital for understanding the seller's pricing strategy. It perfectly illustrates the point. The AI literally chose completely different models for the two different halves of our Vault Key analogy. That blows my mind. It proves precisely why the outcome and the balancing weight must be learned separately. Yes. If you just looked at standard prediction quality, like looking at an R-squared value on a basic regression, you might think one model is just best overall.
17:42But if you force the system to use the same AI representation for both tasks, you would be mathematically compromising your causal truth. That is the danger of relying purely on predictive AI. Prediction does not equal causal target preservation. Right. This real-world test proves that you need the modularity of star aggregation to let the math hunt down the specific context it needs for each half of the equation. And the final star aggregate elasticity, utilizing both of these distinct custom-blended choices, came out to negative 1.053. Which is incredibly precise. It is. But as a natural skeptic, I have to ask the dark question here.
18:23Uh-oh. Even with amazing custom-blended AI models, What if we missed a critical piece of data entirely? What if the AI hallucinates or drops some massive chunk of context? Like what? Like a global supply chain crash or a massive holiday sale that simply wasn't in the text or the images. How do we defend our findings if we know the data might be deeply flawed? You must have a failsafe. You can never assume your AI representation captured 100 % of reality. Right. That's just hubris. Exactly. So this framework provides a defense mechanism called sensitivity inference. It allows analysts to build an identified region for the truth.
19:05An identified region. Yes. Even when you know representation loss is substantial, you can mathematically bound the worst case scenario. But how do you build a boundary for something you don't even know is missing? You run a calibration exercise. You essentially intentionally cripple your own model to see how the math reacts. Oh, interesting. In the Amazon case, they compared a basic text-only model to their massive, full, multimodal model. They intentionally deleted the images and the tabular data. Okay, so they forced a massive error. Right. And by observing exactly how much the outcome error and the balancing weight error shifted when they deleted that known information, they calibrated a sensitivity grid.
19:48So that grid acts as a benchmark for how much damage unknown unknowns could possibly do. Precisely. They figured out the mathematical blast radius of missing data. So they could ask, what if there is unobserved information out there, perfectly aligned by the universe to maximize our error and ruin our analysis? And the math held up. Even when assuming a highly aggressive scenario of missing information, perfectly aligned to maximize the error, the upper bound of the Amazon price elasticity was still negative 0.723. Why should you, the listener, care about this specific number? Because this is your armor in a boardroom.
20:24It really is. It's like standing in front of the executive team and saying, look, even if my AI hallucinated, even if it dropped a massive chunk of real world context, the absolute worst case mathematical scenario still definitively proves my point. Raising prices hurts our sales rank. This completely shifts how we evaluate empirical work. We often obsess over nailing the exact point estimate down to the decimal. Yeah, we get hyper-focused on the 1.053. But here, the sign of the causal effect, the undeniable fact that the effect is negative, is highly robust, even if the exact magnitude shifts from 1.05 down to 0.72.
21:03This framework allows you to make affirmative, confident business decisions while being totally mathematically transparent about your AI's blind spots. It is incredibly liberating. You don't have to pretend your AI is omniscient to trust your causal conclusions. So let's bring this all together. As we collide traditional causal science with cutting-edge AI, we don't have to sacrifice the truth. AI embeddings don't have to ruin causal inference. Because the error we care about is a product of two distinct modeling mistakes. Exactly. Predicting the outcome and predicting the context of the treatment.
21:37Because of that, we can aggressively compress messy real-world data. We can use Foldwise tuning on the fly. We can use Star Aggregation's mixing board to blend massive menus of AI models together. Finding the perfect keys for the vault without breaking our computers. We can test it in the chaos of the real world, like proving Amazon price hikes kill demand, regardless of whether you prioritize text or images. And finally, we can use sensitivity analysis to rigorously bound our worst-case scenarios and defend our findings. It is a complete end-to-end framework. It takes the unmanageable, messy reality of modern, unstructured data and enforces the strict mathematical rigor of classical cause and effect.
22:18It's the bridge we've been waiting for. Which leaves you with one final thought to ponder as you look at the future of this technology. We just learned that causal truths can survive inside intense AI compressions, simply because the AI managed to preserve two specific predictive variables. Right, the outcome and the treatment. So what happens in the near future when we start intentionally training our massive foundation models only to preserve those two causal targets, while actively instructing them to discard the rest of human reality? What does a perfectly causally efficient but completely unrecognizable AI worldview actually look like?
22:55Think about that next time you compress a file.
This paper presents a rigorous framework for performing valid causal inference when complex covariates are compressed into AI-learned representations or embeddings. The authors demonstrate that information loss from compression distorts causal parameters through a product of regression and balancing weight errors. By leveraging cross-fitted double machine learning (DML), researchers can conduct valid Wald inference either for the specific representation-based target or, under target adaptivity, for the full-information target. The methodology accommodates fold-wise fine-tuning without requiring differentiability of the embedding step and introduces star and convex aggregation techniques to combine multiple modality representations. Finally, the framework provides sensitivity bounds to evaluate robustness against unobserved information loss, which is demonstrated through a multimodal demand analysis of Amazon product data.