In short
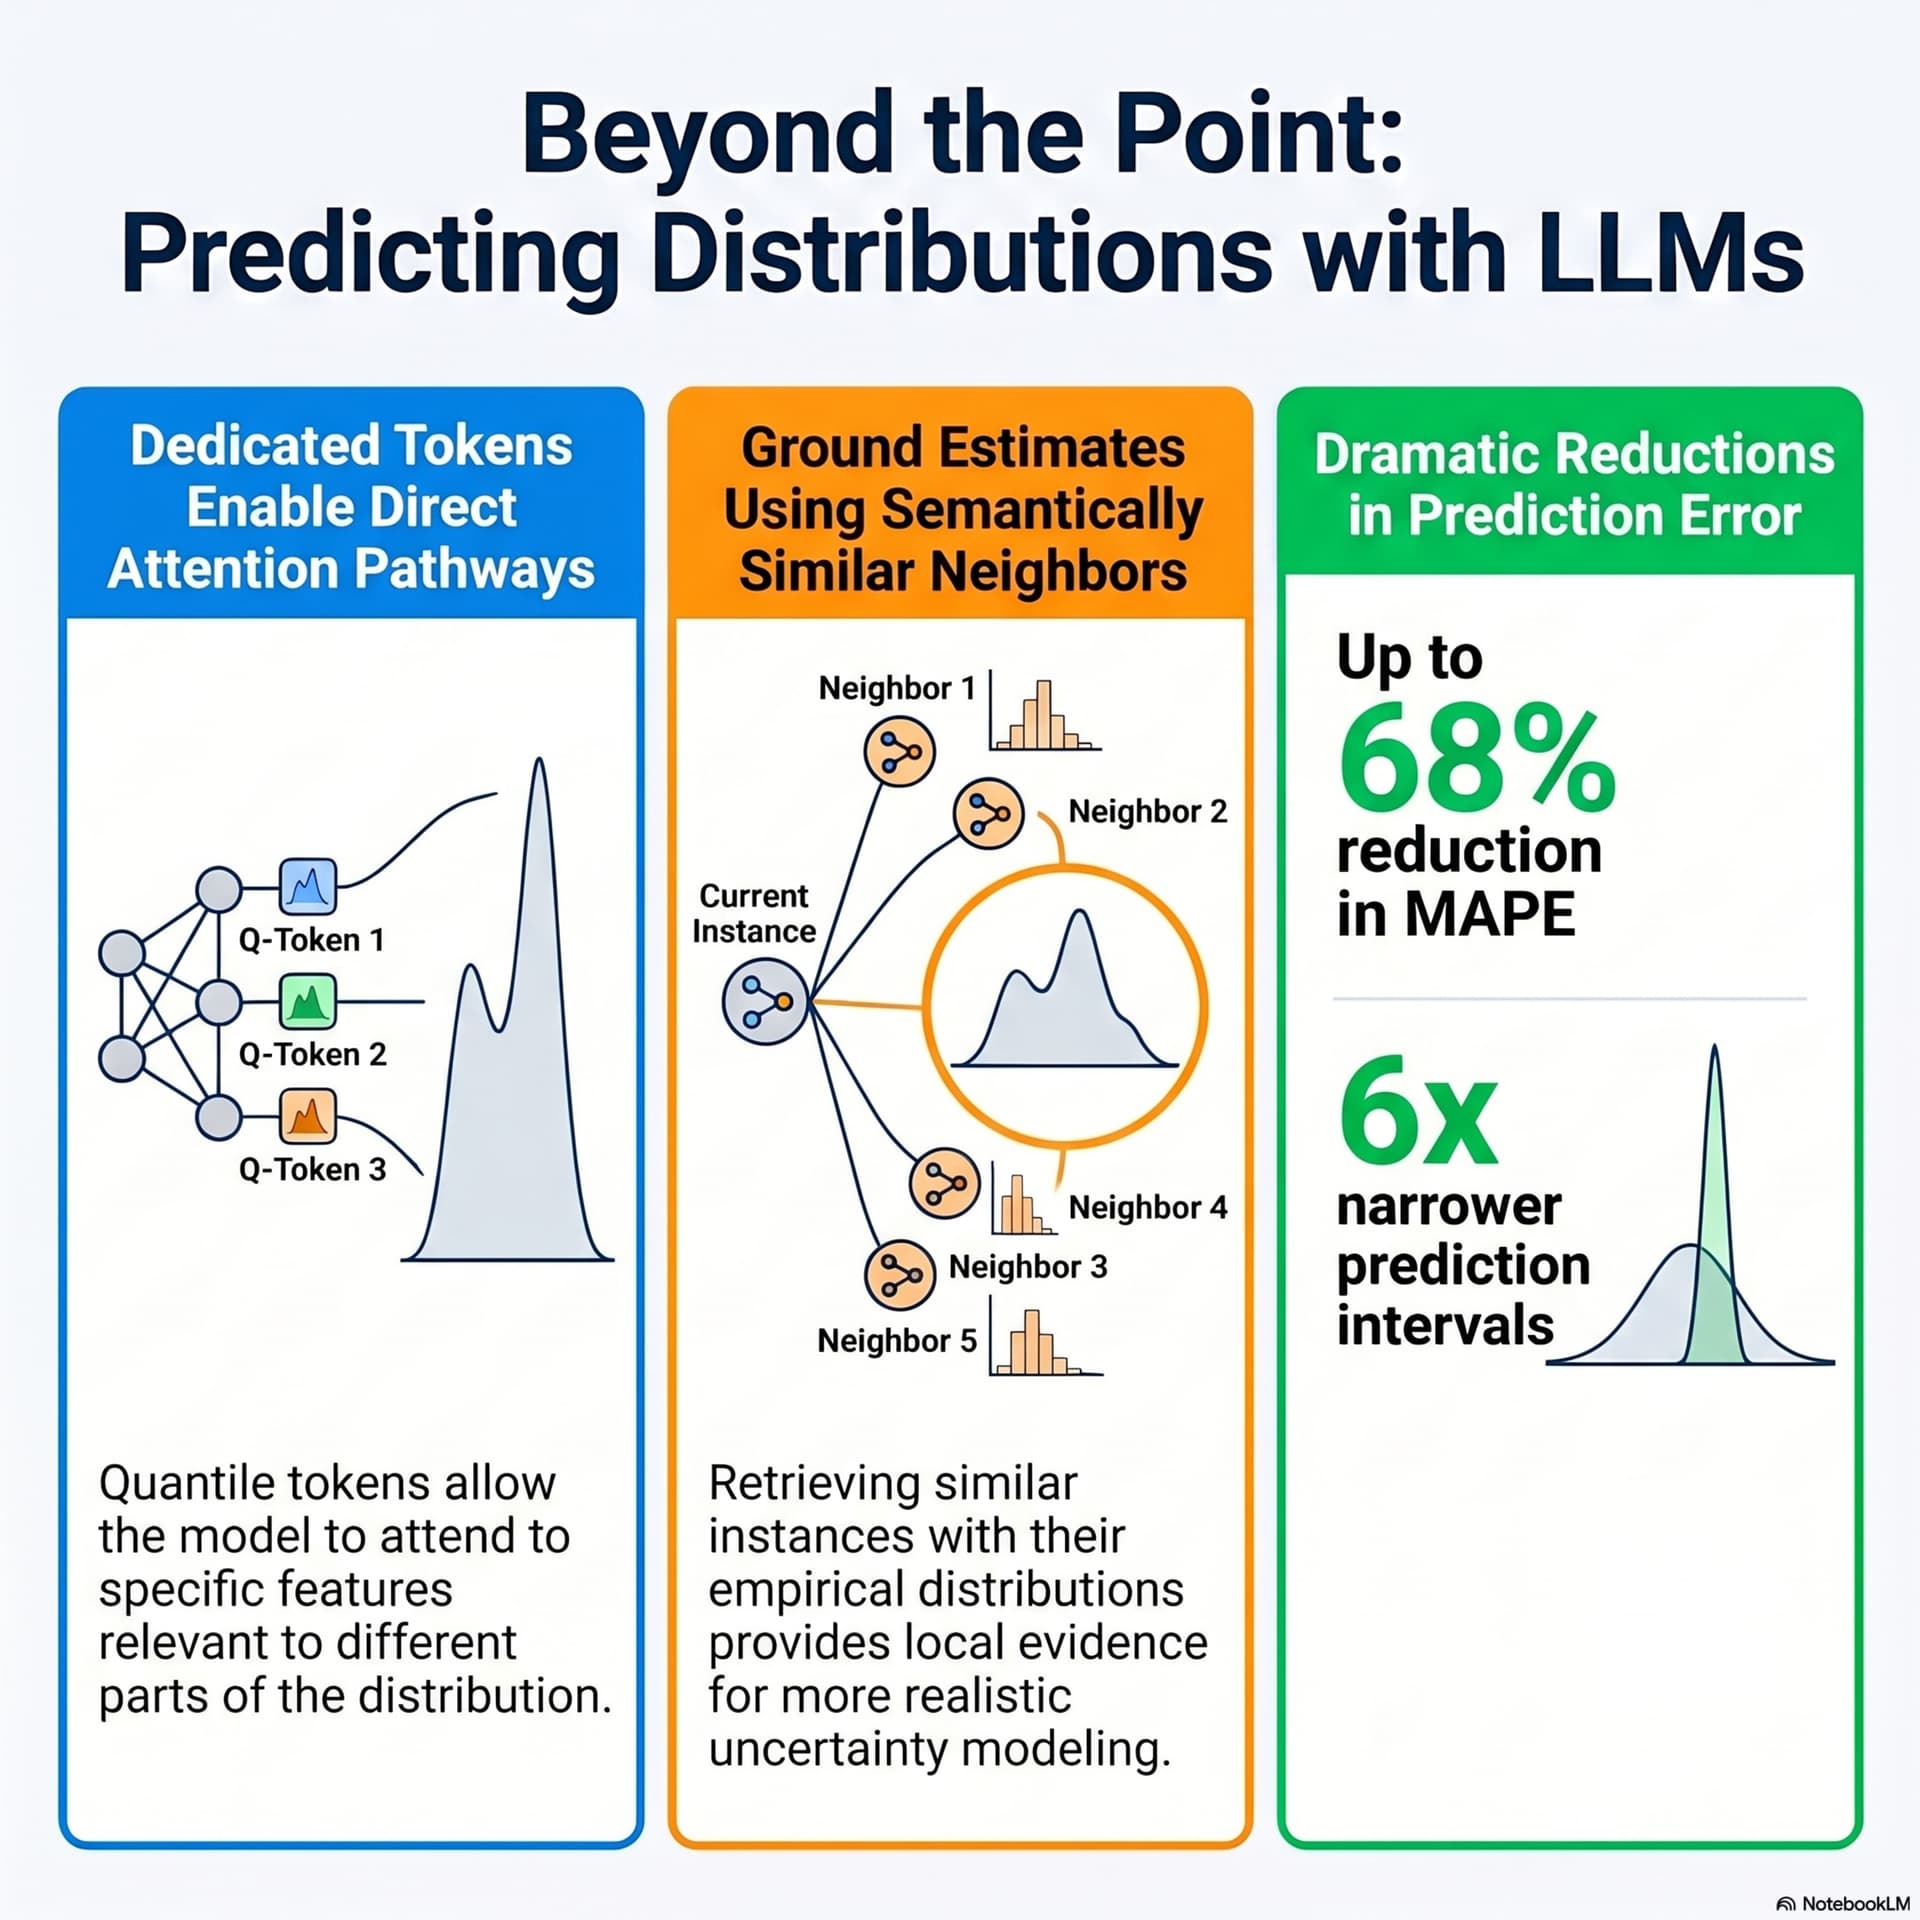
The episode discusses a paper, “Text to Distribution Prediction with Quantile Tokens and Neighbor Context,” arguing that point estimates (means/medians) hide risk and tail behavior. Guests explain that prior LLM regression approaches compress prompt information into a single shared hidden state (“shared representation bottleneck”), preventing rare prompt features from mapping to extreme quantiles. The paper’s first fix uses quantile tokens (e.g., Q10, Q50, Q90) inserted into the input so each token attends independently to different textual evidence and reconstructs a full quantile grid. The second fix uses retrieval-augmented distribution estimation: retrieve eight semantically similar neighbors and feed each neighbor’s full empirical quantile distribution (not a single label). On StackSample, this yields 68% lower mean absolute percentage error and 131x narrower uncertainty intervals; LA out-of-domain retrieval works. A scaling paradox appears at larger backbones, traced to biased pinball loss under finite samples; switching to a Wasserstein-distance loss improves tail calibration.
Notable examples
rental pricing under festivals/empty weeks; StackOverflow response-time extremes. Guests are not identified by name in the transcript.
Written by AI. May contain mistakes. Listen to the episode to check what was said.
Chapters
Tap a time to open that second in VOThe Risks of Average Predictions in Pricing Models
0:00 to 1:42
Learn why relying solely on average predictions can be misleading in pricing models.
“So imagine you are you're deploying an automated pricing model, right?”
Introduction to the Paper on Distribution Prediction
1:42 to 2:08
Explore a groundbreaking paper that changes how AI handles regression tasks.
“Which brings us perfectly to the mission of our deep dive today.”
Historical Limitations of Regression in AI
2:08 to 2:44
Understand the limitations of traditional regression models in AI.
“Yeah, they're forcing the AI to abandon the safety of that single artificially confident guess we just talked about.”
The Shared Representation Bottleneck Problem
2:44 to 4:50
Discover the bottleneck issue in traditional AI regression and its implications.
“The goal is to compel the AI to output a highly granular, dense grid of quantiles.”
The Need for Structural Redesign in AI Models
4:50 to 6:04
Learn about the necessity for redesigning AI structures to overcome existing flaws.
“The extreme best case and worst case scenarios just get completely smoothed over.”
Introducing Quantile Tokens in AI Architecture
6:04 to 8:21
Understand how quantile tokens improve AI's predictive capabilities.
“And that is the research's first major contribution here.”
Retrieval Augmented Distribution Estimation Explained
8:21 to 11:21
Explore how retrieval mechanisms enhance AI's predictive distributions.
“And it does it without requiring separate, massive models for every single quantile.”
Performance Evaluation of New AI Techniques
11:21 to 12:17
Assess the performance results of new AI techniques against traditional methods.
“It sees the off-season dips down to$85, and the peak season spikes up to$165.”
The Scaling Paradox in AI Models
12:17 to 14:00
Examine the paradox of scaling AI models and its impact on performance.
“But the critical question is always whether this theoretical elegance translates to empirical dominance.”
Evaluating Retrieval Mechanisms
14:00 to 14:40
Learn how retrieval mechanisms adapt to unseen data through rigorous evaluation.
“And the robustness really holds up under pressure, too, because on the Airbnb data set, they executed this really rigorous out-of-domain evaluation.”
Show all 16 chapters
The Scaling Paradox Explained
14:40 to 15:20
Understand the paradox of scaling AI models and their performance limits.
“But, you know, looking closely at the scaling data across those QUIN3 models, there is a pretty severe anomaly that contradicts the standard AI playbook.”
The Role of Loss Functions in AI
15:20 to 16:00
Explore how loss functions impact model training and optimization.
“It's a really critical insight into the limits of brute force scaling.”
Challenges with Asymmetric Pinball Loss
16:00 to 18:10
Discover the biases introduced by the pinball loss in quantile regression.
“And if we connect this to the bigger picture, this scaling paradox exposes the most mathematically profound contribution of the entire paper.”
Introducing Wasserstein Distance Loss
18:10 to 19:30
Learn how the Wasserstein distance loss addresses the issues of pinball loss.
“Which totally explains why the prediction intervals were blowing up on the larger models.”
The Future of AI Predictions
19:30 to 20:50
Examine how advanced AI predictions can reshape interaction with data.
“It refuses to let a single, loud, anomalous data point at the extreme edge drag the entire tail out into infinity.”
The Paradox of Behavioral Prediction
20:50 to 22:30
Consider the implications of AI influencing human behavior through predictions.
“It's a fundamentally different way of interacting with data.”
Transcript
Automatic transcript. May contain errors.0:00So imagine you are you're deploying an automated pricing model, right? Right. For luxury short-term rentals. Right. A pretty standard use case these days. Yeah, exactly. So the system looks at a specific property and it tells you, you know, the expected rate is$2 ,000 a week. Okay. But what it completely fails to mention is that there's a 10 % chance the property could actually command$4 ,000 if there's like a local festival happening. Oh, wow. Yeah. That's a massive difference. Right. And there's also a 10 % chance it'll just sit completely empty unless you drop the price. to, I don't know,$1 ,200.
0:36Which means relying purely on that$2 ,000 average is incredibly dangerous. Exactly. An average is essentially a live omission. When you're modeling complex human behaviors or market dynamics, you never just want the mean. You really don't. You want the absolute best case scenario, the catastrophic worst case scenario, and well, the exact probability of every single outcome in between. Because a point estimate, that single flat average number, it basically just collapses all the inherent risk and volatility of the real world into this deceptive metric. Yeah, deceptive is the perfect word for it.
1:13I mean, in any serious deployment, whether you're assessing financial risk portfolios or determining supply chain buffers. Or optimizing server response times. Exactly. The median is rarely the number that actually makes or breaks your operation. What you are actually trying to understand is the dispersion, the tail behavior. The extremes. Right. You need the model to map out the extreme edges of the distribution because those rare outliers dictate your actual exposure to risk. Which brings us perfectly to the mission of our deep dive today. We're looking at a really fascinating paper from researchers at Amazon and Stanford.
1:49It's a brilliant piece of work. It really is. It's titled Text to Distribution Prediction with Quantile Tokens and Neighbor Context. And today we're going to explore how these researchers are essentially dismantling the way large language models currently handle regression tasks. They're pushing the field in a totally new direction. Yeah, they're forcing the AI to abandon the safety of that single artificially confident guess we just talked about. And instead, they're architecting models that generate the full underbridged spectrum of probability. It represents a fundamental mechanical pivot, honestly, because historically, if you were adapting an LLM for standard text regression, you meant, well, you were retrofitting it to output one number.
2:34Right. One single answer. Exactly. The entire architecture was optimized for that singular convergence. But this research targets distributional prediction directly. So they want the whole curve. The whole thing. The goal is to compel the AI to output a highly granular, dense grid of quantiles. Okay, so we're talking about simultaneously predicting the 10th percentile outcome, the 50th percentile median, the 90th percentile, and so on. Right. Reconstructing the entire continuous curve directly from the raw text input. Okay, let's unpack this. Because it really grasps the magnitude of what they've done here, we first have to, like, dissect the exact mechanical failure of how previous models tried to do this.
3:13And it wasn't for a lack of ambition, I should say. No, definitely not. Okay. Prior models did actually try to output multiple percentiles, but they were severely handicapped by their own internal plumbing, essentially. Yes. The researchers used a prominent prior framework, the one by Bedoula et al., as their baseline to demonstrate this exact flaw. Okay, walk us through that. How did the baseline work? Well, in that older state-of-the-art approach, the model processes the input text through its transformer layers, just as you would normally expect. But when it comes time to actually make the regression predictions, all of that rich, multidimensional, contextual data gets funneled down.
3:52Funneled down into what? Into a single, shared, final, hidden state. Everything the model has learned about the text is just compressed into one unified vector. Oh, wow. And then that one vector is fed to multiple different regression heads. In the academic literature, they call this a shared representation bottleneck. A shared representation bottleneck. Okay, so it's basically the equivalent of asking a single incredibly fatigued manager for a nuanced risk report on an entire multinational corporation. That's actually a great analogy. Right, because the manager has limited bandwidth, so they inevitably just average out all the details to fit everything onto a single page.
4:31Exactly. The nuance gets lost in the summary. Yeah. So if you have 50 different department heads, which in this case represent the AI's separate regression heads that are all trying to predict different quantiles, and they all have to pull their highly specific extreme forecasts from that one generalized summary. The nuance is already gone. Right. The extreme best case and worst case scenarios just get completely smoothed over. They don't survive the compression. Because the hidden dimension capacity of that final vector simply isn't large enough to encode the necessary features for every possible edge case.
5:05It's just a physical limitation of the math. Precisely. Because the model compresses the entire distribution's characteristics into that one bottleneck, it completely severs the explicit pathways between rare input features and the extreme output quantiles. So like if a specific regression head is tasked with predicting the 99th percentile, say, I don't know, an exceptionally agonizing 14-hour wait time for a tech support query. Right. A huge delay. Yeah. It struggles to locate the specific textual clues indicating that delay because those minor clues were just averaged away during that pooling process you mentioned.
5:40Exactly. The architecture fundamentally prohibits the model from directly mapping an obscure feature in the prompt to an extreme behavior in the tail. Which means we need a structural redesign. Desperately. Because if the problem is that single bottleneck compressing the data, the solution isn't to just train the bottleneck harder. No, you can't brute force your way out of a structural flaw. Right. The solution is to create parallel specialized pathways. And that is the research's first major contribution here. Essentially, firing that tired manager and hiring a dedicated team of specialists. Yes.
6:13They engineered a mechanism that they call quantile tokens. Go quantile tokens. Instead of pooling the final transformer state into one summary vector, they introduce a set of specialized learnable tokens directly into the LLM's input sequence. Oh, interesting. So they go right in with the prompt. Exactly. So prepended to the actual words of your query, you introduce these artificial tokens. You have Q10 tasked solely with the 10th percentile. Q50 for the median. Yep. And Q10 for the 90th, scaling all the way across the entire probability grid. Here's where it gets really interesting, though, because the researchers didn't just theorize this would work.
6:52They actually proved it by visualizing the internal mechanics. Yes, the attention maps. Right. They tested this on the stack sample data set. And for those listening, this data set basically requires the model to read coding questions from stack overflow and then predict the distribution of response times. A notoriously difficult task, by the way. Extremely. But when you look at the attention maps, those diagnostic overlays that reveal exactly which part of the prompt the model is prioritizing, you see these quantile tokens behaving like entirely independent agents. Honestly, the attention visualizations are the most compelling empirical evidence in the whole paper.
7:30I completely agree. Because each quantile token participates in the self-attention mechanism across every single layer of the transformer, they each develop their own independent query vectors. Right. So the Q10 token, which is hunting for the best case scenario, those incredibly fast 15 minute response times, it learns to heavily weight popular mainstream tags in the text. Like Python or HTML. Exactly. It recognizes that massive communities reply quickly. But the QTOLER token, which is responsible for mapping out the agonizing 11 hour response times, it essentially ignores the Python tag altogether.
8:05It doesn't even look at it. No. Instead, it independently scrubs the deep body of the text, fixing its attention on complex, esoteric code indicators. Things like Essencio, or highly specific traceback errors. What's fascinating here is that this entirely bypasses the shared representation bottleneck. And it does it without requiring separate, massive models for every single quantile. Which would be computationally impossible anyway. Right. You achieve parallel feature extraction within a single forward pass. So Q actively builds its own specialized representation by seeking out velocity indicators, while Q simultaneously constructs its own representation by scanning for complexity indicators.
8:47They share the underlying transformer weights, but they aren't fighting over a final summary vector. Exactly. The direct input-to-output pathway is completely restored. So that gives the model the necessary internal anatomy to process newborns. But, I mean, even with the most brilliant internal architecture, guessing in an absolute vacuum is just a fool's errand. It is. Context is everything. Right. Like, if you're trying to predict the rental distribution of an apartment in Seattle, you don't just stare at the square footage and the countertop materials until a price magically materializes in your head.
9:21No, of course not. You immediately look out the window at the building next door to see what they're charging. Exactly. You need external grounding. Which brings us to their second major innovation. Yes, the implementation of retrieval augmented distribution estimation. Okay, let's break that down. Well, the researchers recognize that the LLM needs to anchor its predictive distribution in the reality of similar historical instances from a database. Okay, but wait, isn't retrieval augmented generation RAG? Isn't that already a thing? What makes this different? It is a thing. RAG is standard practice at this point for factual Q &A.
9:57Right, we inject documents into the prompt to keep the model from hallucinating. Exactly. But applying retrieval to text regressions, specifically to map out full probability distributions, is a completely different mechanism. Because, I mean, how does the model even digest a neighbor in a mathematical context? It requires a significant upgrade to how we define a retrieved neighbor. Prior retrieval methods for regression did exist, but they suffered from the exact same point estimate flaw we discussed earlier. Oh, so they were just feeding it averages again. Pretty much. You would retrieve a semantically similar instance, like a neighboring Seattle apartment, and pass it to the model with just a single label.
10:39This similar property rented for$120 a night. Which just drags the model right back to anchoring on the average. Precisely. The researchers discard that entirely. When their system retrieves a set of semantically similar neighbors, and they actually found that using eight neighbors as the optimal setup, it doesn't pass a single price point. What does that sound sense? It feeds the LLM the entire empirical distribution of that neighbor. It passes a full 99 quantile grid for each and every retrieved instance. Oh, wow. Okay, so the model isn't just informed that a comparable listing average is$120.
11:16It's actually forced to ingest the entire historical volatility of that listing. Exactly. It sees the off-season dips down to$85, and the peak season spikes up to$165. It's comparing the mathematical shapes of probability. Yes. The foundational intuition operating here is that semantically similar inputs naturally project into similar outcome distributions. That makes a lot of sense. Right. If two technical queries on Stack Overflow describe similarly obscure database locks, their response time curves will likely share the exact same heavy-tailed shape. So by injecting the full 99 quantile empirical distributions of eight neighbors directly into the context window, the model is no longer extrapolating the tails from scratch.
11:59It doesn't have to. It has explicit structural evidence of what the extremes look like in that specific neighborhood of the data space. Okay, so we've fundamentally altered the model's internal processing with quantile tokens, and we've enriched its external context with full distribution neighbors. A complete package. But the critical question is always whether this theoretical elegance translates to empirical dominance. When they actually tested this against the baseline, how did it perform? The performance deltas are staggering, to be honest. Let's hear the numbers. So the researchers evaluated this dual-technique approach on the QEM-3 family of foundational models, scaling from 1.7 billion up to 14 billion parameters.
12:40Okay, solid range of sizes. And they utilized two highly distinct data sets. The inside Airbnb dataset for spatial price prediction and the stack sample dataset for temporal response time prediction. And based on the distributions, stack sample is a significantly more hostile environment for a predictive model, right? I mean, human behavioral timing online is vastly more erratic than housing prices. Oh, absolutely. The stack sample data exhibits massive variance and incredibly heavy tails. Because a response could realistically arrive in 60 seconds or stretch over 12 hours based on, like, almost imperceptible shifts in how the question is phrased.
13:18Exactly. Yet, when they deployed the Quantile tokens combined with the eight neighbor distributions, the model dismantled the baseline. On StackSample, they achieved a 68 % reduction in average error. A 68 % reduction? Yes, measured as mean absolute percentage error. A 68 % reduction in error on highly volatile data is a massive leap. But honestly, the metric that truly illustrates the breakthrough here is the impact on the prediction intervals. Yes, the shrinkage there was phenomenal. The width of the model's uncertainty bounds shrank by a factor of 131 compared to the shared representation baseline.
13:53A factor of 131. It went from outputting hopelessly vague, massive probability ranges to incredibly sharp, tightly defined curves. And the robustness really holds up under pressure, too, because on the Airbnb data set, they executed this really rigorous out-of-domain evaluation. They systematically held out every single listing in Los Angeles during the training phase. The LA holdout is the true ascent test for the retrieval mechanism's viability. Why is that? Because the model had never seen a Los Angeles property. Its internal weights had zero geographic prior for that specific market. But because the retrieval system could pull semantically similar LA listings from the external database at inference time, the model successfully constructed highly accurate price distributions for a city it had never technically learned.
14:41That is wild. But, you know, looking closely at the scaling data across those QUIN3 models, there is a pretty severe anomaly that contradicts the standard AI playbook. Ah, yes, the scaling paradox. Right, because the industry dogma is that scaling up parameters uniformly improves performance. Just throw more compute at it, right? That's usually the assumption, yes. Yet, when the researchers scaled this architecture from an 8 billion parameter backbone up to a 14 billion parameter backbone, they hit a wall. They really did. The 14 billion parameter model actually generated wider, less accurate confidence intervals at the extreme tails.
15:19So I have to ask, does this mean giant models are actually worse at handling uncertainty? It's a really critical insight into the limits of brute force scaling. Larger foundational backbones possess immense representational capacity, sure, but that actually makes them hypersensitive to optimization instabilities. Oh, so they just overfit to bad math? Essentially, yes. They are hypersensitive to the specific geometry of the loss function. Merely throwing more parameters at a regression task does not organically tighten confidence intervals. In fact, if the mathematical rule governing the training is flawed, a larger model will just become exponentially more efficient at learning the flaw.
15:57Which implies that the mathematical objective we use to penalize the model during training is actually way more pivotal than the sheer size of the neural network. Exactly. And if we connect this to the bigger picture, this scaling paradox exposes the most mathematically profound contribution of the entire paper. It centers entirely on the loss function. Yes, the specific mathematical gradient that tells the model how to adjust its weights when it makes an incorrect prediction. Because in standard quantile regression, the industry default is usually pinball loss. Right. And it's designed to be intentionally asymmetric, penalizing the model differently based on whether it overshot or undershot to basically force the prediction toward a specific percentile.
16:41That is the standard theory, yes. But the researchers introduced a rigorous mathematical proof demonstrating that when you train a model using empirical finite samples, the standard pinball loss is fundamentally biased. Wait, let me hear if I'm following this. If the model is operating on a tiny handful of actual historical wait times for a specific type of query. Right, an empirical sample. And it's trying to map out the 95th percentile using that asymmetric pinball loss. Is it basically just mathematically obsessing over the noise of those few data points? You have isolated the exact mechanism of the failure.
17:20Really? Yes, because you only have a finite empirical sample, maybe five actual historical response times for a highly specific query. That sample is merely a noisy estimator of the true underlying distribution. OK, that makes sense. The researchers proved that pinball loss targets the quantile of the noisy estimator itself, not the true population. Because of its asymmetry, it over-indexes on the extreme outliers present in that tiny sample. Oh, I see. Mathematically, it introduces an inflation or deflation effect that aggressively compounds the further you move from the median. So the model sees one bizarre anomaly like a guy who took three days to answer a basic HTML question because his router caught fire or his internet went down.
18:02And the pinball loss basically forces the model to heavily bake that single anomaly into his permanent understanding of the 99th percentile. Yes, it artificially inflates the tails. Which totally explains why the prediction intervals were blowing up on the larger models. The 14 billion parameter model was simply better at memorizing the noise. Exactly. The larger model perfectly mapped the bias inherent in the pinball loss. Wow. Okay, so how do we fix it? To circumvent this, the researchers proved that you have to abandon those asymmetric point penalties altogether. They implemented a simpler objective, the LNOLR1-Vosserstein distance loss.
18:38The Wasserstein distance. How does swapping to that prevent the model from being hijacked by those extreme outliers? Well, instead of looking at individual quantile targets and punishing the model asymmetrically, the Ellen-Dollar Wasserstein distance evaluates the holistic shape of the predicted distribution against the empirical target. The shape itself. Right. It measures the total cumulative cost of aligning the predicted probability curve with the observed curve. Okay. The researchers demonstrated mathematically that for this specific type of finite sample supervision, the Wasserstein approach is what they call fissure consistent for the target quantiles.
19:15Meaning that as the model processes more data, the estimator is mathematically guaranteed to converge on the true population value. Exactly. Rather than converging on a distorted, noise-inflated version of it. Precisely. By evaluating the cumulative distance between the shapes, Wasserstein acts as a natural regularizer. It refuses to let a single, loud, anomalous data point at the extreme edge drag the entire tail out into infinity. That is incredibly elegant. It is. In their empirical tests, swapping the loss function alone was responsible for producing the lowest average errors and the sharpest, tightest confidence intervals across the board.
19:53It completely rescued the larger models from the optimization trap. So what does this all mean? You're an engineer designing dynamic pricing engines, or an analyst modeling supply chain disruptions, or, frankly, anyone tracking the trajectory of how artificial intelligence interfaces with human data. It means the ground is shifting beneath us. It really does. This deep dive signals a definitive architectural shift. The era of the hyper-confident single-point estimate is mathematically obsolete. The tooling now exists to demand fully mapped probability landscapes from our language models, and to do so computationally efficiently.
20:27Yeah, we're moving towards systems that don't just give you a number, they give you the context. Imagine an AI that can process a complex prompt and output. Based on these eight semantically identical historical scenarios, the median expectation is X. However, my QtLAT token isolated a specific variable in your query that indicates an 18 % probability of extreme outcome Y. It's a fundamentally different way of interacting with data. It's an architecture that finally equips the model to absorb, process, and actually quantify the chaotic variants of the real world rather than mathematically sweeping it under the rug.
21:04And, you know, investigating that exact capability leads to a rather provocative implication. Oh. Help me. Well, we are observing models that are becoming flawlessly precise at charting the exact probability distributions of human behavior. Sure. They can plot the minute-by-minute behavioral decay of a coding community or the exact threshold where consumer demand evaporates in a housing market. And the accuracy, especially with that Walserstein loss stabilization we just talked about, is just uncanny. It is. But as these precise distribution models are deployed into production, what happens when enterprises systematically use them to set their pricing floors or their algorithmic service level agreements?
21:43Oh, I see where you're going with this. If a property management conglomerate prices thousands of units strictly based on the AI's predicted distribution curve, and a platform modulates its visibility algorithms based on expected wait-time curves, do the models eventually cease predicting human behavior and begin enforcing it? Wow. We deploy the architecture to capture the messy organic variants of the world. But if the AI's output becomes the ubiquitous baseline that all our human systems conform to, we risk engineering a closed feedback loop. Exactly. The extreme tales of human variants might be systematically ironed out by the sheer gravitational pull of the AI's expectations.
22:22We literally build a machine to map the spectrum, and the machine ends up collapsing the spectrum back to the average. It is a profound paradox. It really is. Something to consider the next time you interact with an algorithmic pricing search. For sure. We will leave you to explore the implications of that closed loop on your own. Keep diving deep.
From the publisher
This paper introduces Quantile Token Regression, a novel framework designed to improve how large language models predict full probability distributions from unstructured text. Unlike previous methods that rely on a single representation for all outputs, this approach inserts dedicated quantile tokens into the model’s input to create direct pathways for estimating specific distribution levels. The researchers further enhance accuracy by using retrieval-augmented grounding, which incorporates semantically similar "neighbor" examples and their known data patterns into the prompt. Their mathematical analysis demonstrates that using Wasserstein-based loss functions provides superior results over traditional pinball losses for this specific task. Extensive testing on Airbnb and Stack Overflow datasets proves that these techniques significantly reduce error rates and produce much sharper, more reliable predictions. Ultimately, the study offers a scalable architecture for complex tasks like price forecasting and risk assessment, where understanding uncertainty is as critical as predicting a central value.


